
SendFast Q1 2024: where should a remittance startup focus next?
A leadership analysis of one quarter of transfers and signups for SendFast, a fictional Canada and Nigeria remittance company. SQL and Python show a loyal customer base, shrinking transfer values, and a signup funnel that leaks at KYC.
- Transfers analysed
- 164,882Transfers analysed
- Signups analysed
- 21,906Signups analysed
- Slides, with speaker notes
- 12Slides, with speaker notes
Read this first
SendFast is a fictional company, and all data in this case study is synthetic. It was generated for this project and doesn't come from any real company, customer or transaction.
The question for leadership: how healthy is the business, and where should we focus next?
What I found
| Finding | Evidence |
|---|---|
| Customers stay | About 12,300 people send each month, and 79% of one month's senders send again the next month. |
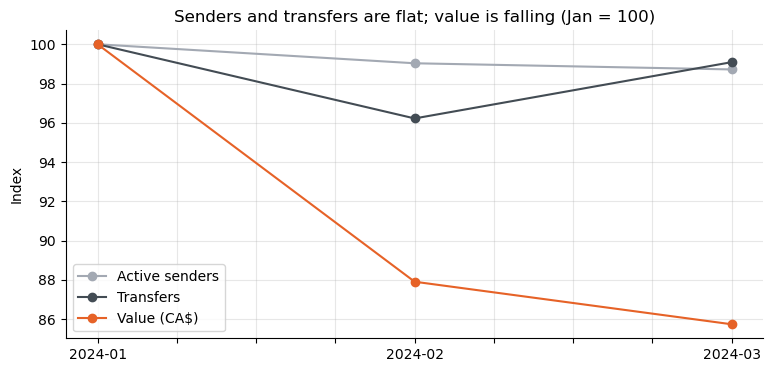
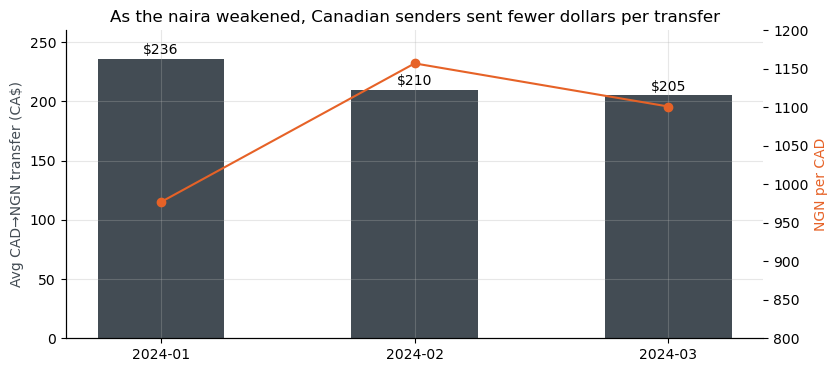
| Each transfer is worth less | Senders and transfer counts are flat, but monthly value fell 14% from January to March (CA$21.9M to CA$18.8M). The average CAD to NGN transfer fell from CA$236 to CA$205 as the naira weakened. |
| NGN to CAD is the high-value corridor | It is 13.5% of remittances but 48% of remittance value, averaging CA$1,300 a transfer. 40% of these transfers are school-related. |
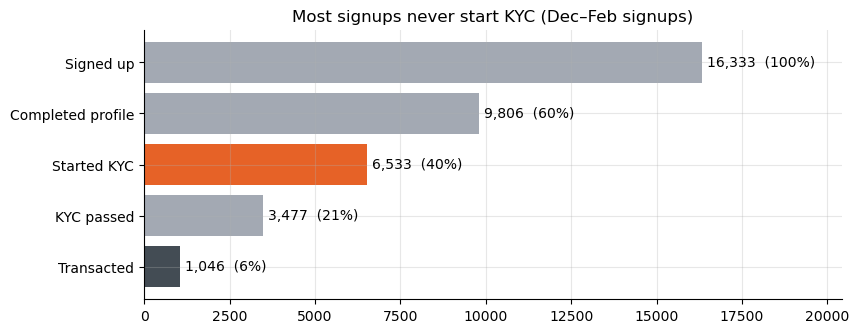
| New signups rarely become senders | Only 6.4% of signups with at least 30 days to convert ever sent money. 60% never started KYC, rising to 70% in Nigeria. |
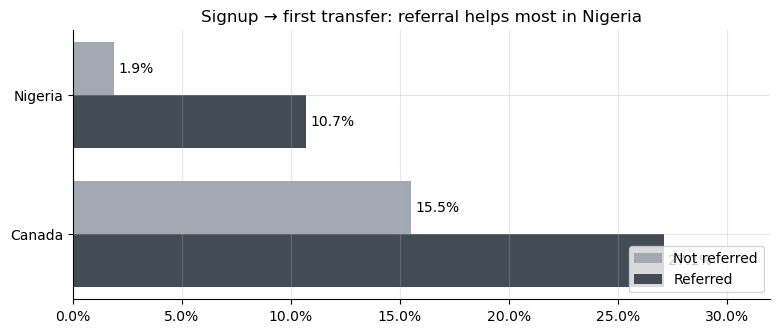
| Referral gets Nigerian signups through KYC | Within each country, referred signups are 5.6 times as likely to send in Nigeria and 1.7 times in Canada. Referral lifts activation but not retention. |
What I recommended
- Get Nigerian signups into KYC: start it straight after signup, show the required documents up front, and follow up with people who stall.
- Use referrals to drive KYC: pay the reward once the invitee passes KYC and makes a first transfer, and test the change to confirm referral causes the lift.
- Protect NGN to CAD tuition payments: run targeted lifecycle campaigns for school-related senders, and look after the top 10% of customers, who send 51% of all value.
How I did it
The notebook loads both CSVs into an in-memory SQLite database and answers each question in SQL, with pandas and matplotlib for checks and charts. It runs top to bottom in about 10 seconds. The steps: data quality checks, base health, retention, value, corridors, the signup funnel, and referral.
What the data can't say
- Two populations. Transactions cover every customer who sent money, while the users table is a slice of new signups. Funnel and referral results cover new signups only.
- December is a single day, so monthly comparisons use January to March.
- Same-currency rows are account debits, not remittances, and are excluded from corridor analysis.
- The exchange-rate link covers three months, and the referral effect rests on 307 referred Nigerian signups, so both are associations, not proven causes.